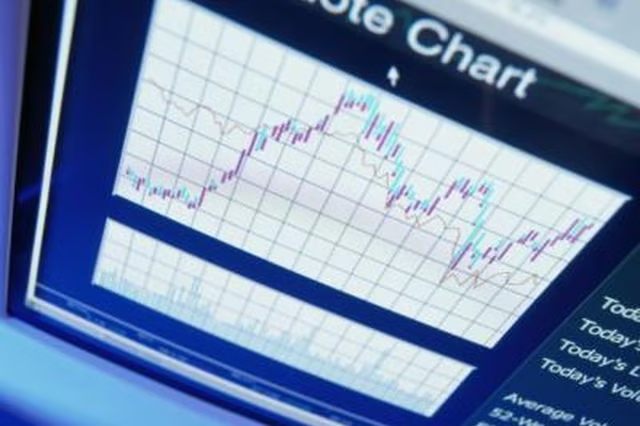


If you want to see up-to-the-minute price action for a stock or other security, an intraday chart will not disappoint. This type of chart shows an investment’s price movements and trading volume within a given trading day -- typically between 9:30 a.m. to 4 p.m. Eastern time. Because of their narrow time window and high level of detail, intraday charts typically cater to traders looking for short-term price trends. But longer-term investors can also use them to check out the market’s sentiment toward an investment and see its reaction to news and other announcements.
Step 1
Visit any financial website that provides investment quotes, or log in to your online brokerage account. Type a security’s ticker symbol of capital letters into the quote text box and click the adjacent button. This button might be called “Get Quote,” “Search” or something similar, depending on the site.
Step 2
Click “Charts” or a similar link. Select “Intraday” or “One Day” for the time range to see the investment’s intraday chart.
Step 3
Review the times listed on the chart’s bottom, horizontal axis. These represent normal market trading hours. For stocks, they begin with 9:30 a.m. on the left side of the chart and increase to 4 p.m. on the right. They may differ for other investments, such as commodities.
Step 4
Identify the line that fluctuates up and down across the chart. Each point on this line matches up with a time on the horizontal axis and a price on the vertical axis to designate the investment’s trading price at that time of day. For example, if the price line on a stock’s intraday chart aligns with $33 at 12 p.m., the stock traded for $33 at high noon.
Step 5
Locate the thin horizontal line in the middle of the chart that spans the length of the chart. Identify the price it aligns with on the price axis. This represents the investment’s closing, or last, price from the previous trading day. In this example, if the horizontal line is at $32, the stock closed at $32 the previous day.
Step 6
Find the rightmost point on the price line to determine the current price. Check its location in relation to the horizontal closing-price line. If the current price is above the horizontal line, the market is more optimistic about the investment than it was at yesterday’s market close. If it’s below the horizontal line, the market is more pessimistic. In this example, assume the current price is $34 at 3 p.m. This suggests investors like the stock now more than yesterday.
Step 7
Find the box below the chart with the vertical bars in it. This box is always labeled “Volume.” Check out the time directly above each bar on the chart’s horizontal axis. Identify the number on the volume box’s vertical axis that aligns with the top of each bar to determine the number of shares traded at that time of day. The bars with the highest volume often coincide with big price movements and sometimes with major news announcements. Concluding the example, assume the 2 p.m. volume bar is at 300,000. This means 300,000 shares traded at that time.